| Kahawai
Submission
by
Mark Feldman
22
February 2004
Mark Feldman
Kerikeri
Northland
February 22, 2004
Regarding: Initial Position Paper on kahawai dated
January 12, 2004.
The most significant problem with the IPP is that the Minister was
not provided with a range of options to choose from.
Kahawai is an important species to over a million New Zealanders,
many of lower socio-economic classes. There is not much “hard”
data available about the species and virtually all the “soft”
data available (much of it left out of the IPP) points towards a
declining fishery. Despite these facts MFish has offered the Minister
only one management choice, a choice that ignores the facts and
proposes to increase the commercial catch at public expense.
With so many unknowns, the minimum expectation is that the Minister
would be provided with a range of options based on different interpretations
of the available data. Because kahawai is of far greater value to
the recreational and tourist sectors one of those options would
have to be making kahawai a by-catch only species.
The comments that follow relate to the item numbers on the left
side of the page in the IPP.
2b: “The current biomass is unknown…reported landings
are currently just within the range of MCY estimates…”
The biomass is unknown and the MCY is pure conjecture. Basing management
decisions for an important fishery on inadequate evidence is reckless
and irresponsible. Far more weight should be given to the data we
have from recreational fishing sources, tagging studies, and fork
length studies. These are summarised in Item 102 and reflect a declining
fishery that is no longer able to provide adequate resources for
the recreational sector.
2d: “Declining catch in QMA3 is associated with reduced purse
seining in this area.” The question here is which came first,
the reduced purse seine operations or the depleted fishery. MFish
has accepted Sanfords story that they just chose to reduce their
South Island operations for logistical reasons. But I do not believe
that is correct.
In 1993 the scientists that had worked on “The Biology and
Purse Seine Fishery of the Kahawai From Central NZ During 1990/91-1991/92”
expressed grave concerns to me at the Plenary about the state of
the fishery in Kah 3 as a result of the uncontrolled kahawai catches
(14 million fish in a decade).
The rationalization that Sanford/Sealord provided was that weather
conditions prevented them catching their quota in 1991-’92,
but the continued failure to catch fish after that season convinced
me their explanation was false. Events since then have confirmed
my impression that they have withdrawn from Kah3 because it’s
too hard to find the fish, NOT for any other reason.
You would have to be pretty naïve to believe Sealords and Sanfords
stopped fishing QMA3 for any other reason than a reduced CPUE and
it is inappropriate for MFish to accept that story without proof.
2F: “The recreational sector believes that the number of kahawai
available to them and the average size of kahawai has decreased
over time.”
This is true yet MFish suggests that the status quo is the preferred
management plan. This is very poor reasoning when you consider Item
129 where MFish points out the value of the recreational fishery
is 11-16 times greater than the commercial fishery, and Item 102
backing up the claims of the recreational/tourist sector that the
fishery is stressed. The only conclusion I can come to from this
reasoning is that MFish has a major commercial bias.
MFish has also left out of the IPP the results of tagging studies
done between 1983-1991, and fork length studies, both of which strongly
supports the arguments of the recreational sector. This issue will
be examined under Item 102.
6: All of Item 6 and the IPP are focused on managing the kahawai
fishery on the basis of MSY. This is ridiculous for two reasons:
- We have no idea what the MSY is.
- The recreational and tourist needs are not being satisfied now
(very low CPUE, declining size of fish). Since the recreational
fishery is much more valuable, satisfying the needs of the recreational
and tourist sectors should be the basis of management NOT a MSY
based on lousy data
11: “Trends in non-commercial catch during this period (since
1993-‘94) are unknown.”
This is not so. Again, Item 102 indicates that the recreational
survey in 1997 showed that the fishery was still in decline. In
addition, data from NZ Angling Ltd. reveal that kahawai catches
in their tournaments show an ominously steady decline from 1994-2000.
And the endless stream of concern about the fishery still continues
unabated. That data is available on the option4 website: https://www.option4.co.nz/Fisheries_Mgmt/kahsnzal.htm
20: “The proposal to set TACs at the level of current utilization
assumes that these perceptions are associated with a reduction in
the kahawai stock to a level at or above Bmsy and not below that
level.”
Again, we don’t have a clue what the MSY for kahawai is. We
also have no idea what the biomass is. What we do know is
that there are not enough fish in the water to satisfy the recreational
needs and THAT should be the basis of management.
23: “Mfish considers that the disparity in relative value
between the sectors supports the need for caution in setting catch
limits for the fishery.”
This is correct. But the proposal to continue the status quo is
NOT cautious. We already know the commercial catch is so high that
it has reduced the CPUE for the recreational sector to an unacceptably
low level.
Really, by now Mfish should have gotten the message that something
is wrong with the management of the kahawai fishery.
34: “…currently there is no scarcity within the fishery.”
This is just plain dumb. What do you think Item 102 means? These
recreational surveys and your own CPUE figure in Item 102 all indicate
the kahawai are way too scarce to support a valuable recreational
and tourist fishery.
35: “…TACCs have been calculated using average commercial
landings for the period between 1997 and 2002.”
In a damaged fishery where the recreational sector has fewer and
smaller fish, and the commercial sector has had declining catches
in every QMA, Mfish wants to base the TACCs on the much higher catches
of seven years ago.
That decision represents very poor judgement and is certainly NOT
cautious management.
49: “...declining catches in QMA 3 is associated with reduced
purse seining in this area.”
As in 2d, cause and effect are confused here. I believe the catch
has declined because the fish aren’t there. That’s why
the purse seiners don’t go there anymore.
50, 52: Here it’s proposed that “nominal” TACCs
of 10 tonnes be set in Kah 4 and Kah 10, areas where there is no
catch now.
In a depleted fishery, why would you want to do that?
65c: “Current recreational concerns with regard to the reduction
in availability of kahawai to them are not addressed by setting
TACs based on current levels of utilization.”
This is true but MFish has chosen to ignore it. Does Mfish seriously
believe that a CPUE of 0.2 kahawai per hour is acceptable? Does
MFish think it’s wise to throw away a high value recreational
fishery for a very low value commercial one?
65e: “Kahawai fishing is not known to pose a risk to the long
term viability of any associated or dependent species.”
This is scientific jabberwocky and is only true because MFish is
keeping its eyes closed. Even a brief glance at the sea would reveal
that terns and shearwaters are heavily dependent on kahawai to feed.
The reduced number of kahawai schools explains the easily observed
decline in their populations.
65L: “…uncertainty and the absence of information is
not a reason for failing to provide for utilization at levels considered
to be sustainable, however MFish notes that caution is required
in this instance.”
MFish is clearly NOT being cautious here. Recreational fishers feel
the kahawai fishery has NOT recovered from the gross overfishing
of the previous 20 years and is still in decline. Since MFish has
no better information available it would be cautious to substantially
reduce the latest commercial catches, not increase them.
98: “Kahawai anglers are characterised as follows:…more
likely to fish for eating purposes….more likely to fish from
jetty or land platforms….have a lower average fishing expenditure…”
I’m sure these are all accurate statements but the MFish proposal
to increase the TACC for kahawai ignores the needs of these anglers,
who represent the lowest socio-economic classes; people that cannot
afford fish unless they catch it. Does MFish think it’s reasonable
for a financially disadvantaged person to have to fish for 15 hours
to catch a feed of kahawai for his family? I hope not.
102: “Recreational groups have repeatedly expressed concern
about the state of the kahawai stocks…In 1997 47% felt the
kahawai had ‘declined significantly’ and 32% felt that
they had ‘declined a little.”
What was left it out here is that over half these respondents had
fished over 20 years. This represents a LOT of experience and is
the best information available on the kahawai stocks, certainly
heaps better than the “shit in, shit out” formulas in
Items 108-114 in the IPP.
102: “Boat ramp surveys conducted by MFish….indicated
that catch rates of kahawai by recreational fishers were <0.2
fish per hour, however these values included trips targeting other
species and therefore may be artificially low.”
I don’t believe the catch rate of 0.2 fish per hour is artificially
low for the following reasons:
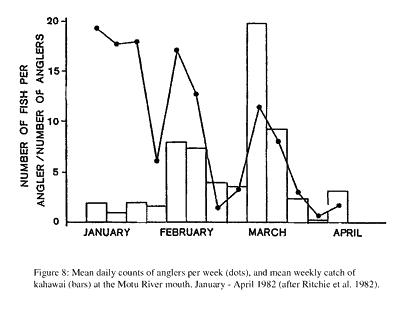
- Catch data from the Motu River mouth area shows a decline in
CPUE from 4.2 for locals (2.6 for visitors) in 1982 to less than
0.1 in 1991. The fishery has certainly declined since 1991 so
the CPUE figure is even lower now. Details are on pages 17-18.
- The boat ramp and diary studies of the 1990’s indicated
a catch of 0.4 kahawai per angler per trip. Any reasonable person
would conclude that’s a very poor catch rate.
- The CPUE for snapper in the North region is three times higher
than the CPUE for kahawai and we know that the snapper fishery
is below the Bmsy in the North
The other problem is with the term “targeting.” For
the vast majority of today’s fishers the catch rate of all
species is so low that virtually all fishers are targeting kahawai.
Even if they’re ostensibly targeting snapper their techniques
are equally effective for kahawai and, if a surface school of kahawai
were to come by, they would try to take advantage of it since they’re
most likely NOT catching anything else anyway.
102: Significant sources of data have been left out of Item 102.
The material below has been obtained from the tagging studies done
in 1983 and 1991 and the fork length studies done between 1983 and
1992. The information is as follows:
- If a simple comparison is made between the returns from the
tagging programs in 1983 and 1991 there’s a striking result.
The comparison is between the tag returns from purse seine operations
and recreational rod and reel fishers in the Bay of Plenty. In
1983 recreational anglers returned 72% of the tags. By 1991 the
proportion had dropped to 27%. At the same time the proportion
of returns from the purse seine vessels rose from 28% to 72%.
I believe this indicates the recreational catch as a proportion
of the total catch was much higher in the early 1980s than it
is now. This implies a dramatic decrease in the recreational catch
and CPUE over the decade. A more detailed explanation, including
the original data, is available at the end of this report on pages
6-8.
The essential message here is that, with the blessing
of MFish and despite the objections of the recreational sector
and warnings from MAF scientists, the kahawai resource was reallocated
from the Kiwi public to Sanfords and Sealords. I object to the
loss of those property rights and to MFish using past mistakes
as a justification for giving those rights away in perpetuity
by calling it the status quo.
- Analysis of fork length studies done in 1983 and 1992 showed
a decline of 5.7cm in the size of purse seine caught kahawai in
the Bay of Plenty. A comparison of rod and line caught kahawai
from various sites around the North Island showed a similar decline
in fork length from 1983 to 1991 from every site examined. A more
detailed explanation, including the original data, is available
at the end of this report on pages 9-16 .
112: “The above estimates are uncertain and depend on the
model assumptions and input data.”
You bet! This is the “shit in, shit out” principle.
It is absurd for MFish to make important social/economic decisions
on the basis of hypothetical data.
The data presented in Items 108-113 is much less reliable than that
obtained by recreational surveys, MFish’s own ramp surveys
and the data presented above under Item 102.
119: “Kahawai….make available the prey species to other
predatory species.”. This statement is certainly correct but
then the IPP goes on to say, “There is no information on whether
current kahawai fishing activities are detrimental to the long term
viability of any other species.” Like Item 65e, this is another
example of scientific jabberwocky; the old “there is no evidence
routine.”
The reality is that kahawai
are especially significant for terns and shearwaters that are dependent
for food on the kahawai. The vast flocks of these birds in the North
have been dramatically reduced because they cannot feed without
the help of the kahawai. This information should be included in
the IPP and would be obvious to anyone that has spent time on the
water over the past 20 years.
129: “…a commercial value for kahawai…which is
approximately one sixteenth to one eleventh of the estimated value…of
kahawai caught by recreational anglers.”
I’m sure this is just about right and I published similar
data a decade ago. It is inconceivable that MFish would recognize
this disparity in value and yet recommend an increase in the commercial
catch for this stressed fishery. Imagine what it would be like in
court if MFish had to justify destroying about a hundred million
dollars in value to our society by recommending the continued purse
seining of kahawai.
The kahawai issue will invite significant attention from the media
and MFish will have to defend itself to the press and the courts
unless major changes occur in the final position paper. It’s
about time to rethink MFish’s strong commercial bias.
TOP
A
Comparison of the Rates of Recovery by Purse-seiners and Rod and
Line Fishers of Tagged Kahawai from the 1983 and 1991 Tagging Studies
in the Bay of Plenty
Summary
A comparison of the tag returns from the kahawai tagging programs
in 1983 and 1991 was made. The comparison was based on the tag returns
from purse-seine operations and recreational rod and line fishermen;
it was limited to the Bay of Plenty.
In 1983 the rod and line fishers returned 72% of the tags. By 1991
that proportion had dropped to 27%. During the same period the proportion
of kahawai tags returned by the purse-seiner operators rose from
28% to 73%.
We believe this indicates the recreational kahawai catch was much
higher in the 1980’s than it is now, and the number of kahawai
available to the recreational sector has declined significantly.
A change needs to be made to the Working Group document to reflect
the probability that the recreational catch and CPUE were higher
in the 1980’s than they are now.
Background
The boat ramp and diary studies done by the Ministry during the
1990’s have revealed an average catch of one half of a kahawai
per person per trip in the North Region; a poor catch by any measure.
Unfortunately there is very little data available to quantify the
recreational catch in the mid 1980’s, before the sharp increase
in purse-seine catches that were associated with the introduction
of the QMS. Up until now only one study was available; a CPUE study
at the Motu River mouth done in 1982. This study was never repeated
in exactly the same manner, but a comparable study of the Bay of
Plenty in 1991 suggested a severe decline.
In 1997, the results of the 1991 kahawai tagging study became available.
For a number of reasons outlined by Elizabeth Bradford in her 1997
paper called, “Estimation of Kahawai Recreational Catch from
Tagging Returns ….” It was not possible to use either
the 1983 or the 1991 tagging studies to calculate a kahawai biomass
or quantify the recreational catch. In both of these studies all
the tags recovered were not returned, the amateur and commercial
effort distributions were not the same and the tagged kahawai were
probably not evenly distributed in the population.
Since both the 1983 and 1991 tagging studies suffer from the same
flaws in the same way it is reasonable to assume the effects smooth
out when the studies are compared. For instance, its well known
that tags from individually handled fish are more likely to be returned
than tags from purse-seine caught fish. That is not a problem if
you only want to compare the studies, because tags recovered by
purse-seiners had the same chance of being returned in both 1983
and 1991. Likewise, tags recovered by hook and line fishers had
the same change of being returned in 1983 and 1991.
In a similar fashion, the differences between the amateur and commercial
effort distributions were likely to be the same in 1983 and 1991,
and the irregularities of the mix of tagged kahawai with the general
population were probably equivalent too.
In 1983 most of the kahawai tagging operations were performed from
June to September. In 1991 the tagging was completed in July. During
the 1980’s- 1990’s the total recreational fishing effort
was probably stable with population increases offset by a lower
percentage of people fishing. Weather conditions, which influence
the total recreational catch, were actually better after the 1991
tagging effort than after the 1983 effort, so weather was not the
cause of the decline in the proportion of kahawai caught by the
recreational sector. The total purse-seine catches in KAH1 during
the periods 1983-87 and 1991-95 were almost identical so that is
also not a factor in the relationship. The percentage of tag returns
in the 1983 study was 9.7% (138/1427) and the percentage for 1991
was 11.9% (551/4622); certainly comparable return rates.
Results
During both the 1983 and 1991 tagging studies large numbers of kahawai
were tagged in the Bay of Plenty. Records of tag returns were kept
over the following years. These tag returns were divided between
the purse-seine fishery and the recreational rod and line fishery.
By using these tag return figures it is possible to calculate a
relationship between the proportion of tag returns by the purse-seiners
versus rod and line fishers in 1983 and 1991.
In 1983 72% of all tags returned in the Bay of Plenty were from
rod and line fishers. In 1991 that proportion declined to 27% of
all tag returns. The reverse was true for the purse-seine fishery;
in 1983 28% of tag returns were from the purse-seiners. By 1991
that proportion had increased to 73% of returns.
Data and Sources
A Comparison of Total Tag Returns Between the 1983 and 1991 Kahawai
Tagging Studies in the Bay of Plenty
| Year
Tags Were
Returned |
1983 Tagging
Study
(1434 kahawai tagged) [1] |
1991 Tagging
Study
(4622 kahawai tagged) [2] |
| Year 0 - 1 |
76 tags or 5.2% |
366 or 7.9% |
| Year 1 - 2 |
49 tags or 3.4% |
216 or 4.7% |
| Year 2 - 3 |
13 tags or 1.0% |
91 or 2% |
| TOTALS |
138 or 9.6% |
673 or 14.6% |
A Comparison of the Tag Recoveries by the Purse-seine versus
the Rod and Line Fisheries (only) from the 1983 and 1991 Kahawai
Tagging Studies in the Bay of Plenty
| Source of Tags |
1983 Tagging Study
(1434 kahawai tagged) [1] |
1991 Tagging Study
(4622 kahawai tagged) [2] |
| Purse-seine |
18 or 28% |
424 or 73% |
| Rod and Line |
47 or 72% |
158 or 27% |
Conclusion
From this data, it is reasonable to assume that the recreational
kahawai catch was much higher in the 1980’s than it
is now. Although it is impossible to be certain, a figure
of 4000-5000 tonnes per year would be most likely.
Since the number of recreational fishers has probably been
stable over the decade a catch of 4000-5000 tonnes in the
1980’s implies a dramatic decrease in the recreational
CPUE over the past decade.
[1] Wood, B.A. Bradstock, M.A. and James, G.D. 1990: Tagging
of Kahawai in NZ, 1981-1984. NZ Technical Report No. 19
[2] Bradford, E. 1995: Growth and Biomass results from the
1991 kahawai Tagging Experiment.
TOP
The Decline of Fork Length of Kahawai in
the Bay of Plenty Purse-seine Fishery from 1983 to 1992
Summary
We believe there has been a decline of 5.7cm in the fork length
of purse-seine caught kahawai in the Bay of Plenty between 1983
and 1992. This issue has been debated at the Pelagic Working Group
before. However, there were two significant errors made at the Working
Group:
- We were misinformed about the nature of the 1983 catch samples.
We were told the 1983 fish selected for measurement were the larger
fish available. This is not correct. They were selected at random.
- We were not presented with the results of a boot-strap analysis
that concluded there was a 95% chance the 1991-92 catches did,
indeed, have a smaller fork length than in 1983.
In addition, some new evidence has come to light about the fork
length of line caught fish in 1983 which shows a general decline
in the fork length of line caught fish throughout the North Island
when compared to 1991 data.
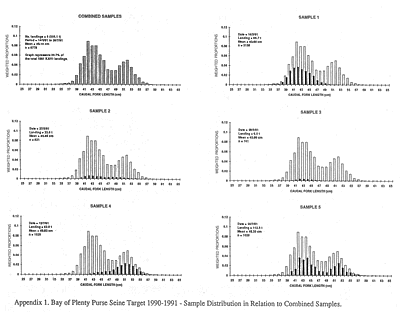
Available Information
As part of a 1983 tagging study of kahawai the fork length of 332
kahawai were measured in the Bay of Plenty. Of these 332 fish, 32
were line caught. Their median length was 49.8cm (see
page 12 for details).
The other 300 fish were purse-seine caught; three landings were
sampled with 100 fish sampled in each landing. The first two landings
measured represented a single school each. The last landing may
have involved more than one school (Gavin James provided this information).
The median length of the three landings of purse-seine caught fish
were 52.7, 49.3 and 51.8cm. These fish were selected at random.
The average of these means is 51.3cm.
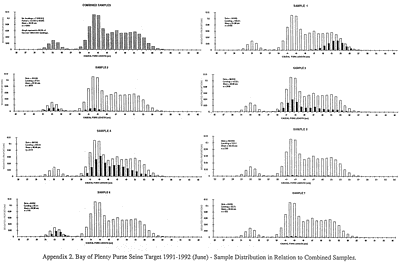
In 1991-92 a shed study was done on kahawai. In 1991 five landings
were sampled with 6778 fish measured. These landings also represented
purse-seine targeted schools. The mean size was 46.1cm.
In 1992 seven landings were sampled. These landings also represented
purse-seine targeted schools. A total of 12,431 fish were measured.
The mean size in 1992 was 45.25cm.
The average of the 1991-92 means was 45.6cm.
Just recently an analysis was done comparing line caught kahawai
in 1983 to line caught fish in 1991 in various locations around
the North Island. In every location there was a decline in the fork
length of the fish. This data is available on page
15.
The majority of line caught fish in 1983 were caught trolling. Most
fish in 1991 were caught on bait. We were concerned about a possible
difference in size of fish caught, based on whether a lure or bait
was used. An analysis of available 1991 data indicates bait fishing
usually catches the biggest kahawai so that cannot be a factor in
the decrease in fork length we found. That data is available on
page 16.
TOP
Mean Fork Lengths of Kahawai
(target purse-seine only); 1983 vs. 1991-92
| 1983 |
1991-92 |
| |
33.4 |
| |
37.4 |
| |
43.4 |
| |
43.6 |
| |
45.4 |
| |
45.5 |
| |
46.0 |
| |
46.0 |
| |
46.3 |
| 49.3 |
46.5 |
| |
49.8 |
| 51.8 |
51.3 |
| 52.7 |
|
Discussion
Several points need to be made about the available data.
- It would be difficult to imagine how the combined commercial
and recreational fisheries in the Bay of Plenty could remove around
40,000 tonnes of kahawai (about 25 million fish) in a decade without
a decline in fork length.
- One of the arguments against accepting the 1983 data as representative
is that kahawai school by size; therefore just sampling three
or four schools is not adequate. It is true that kahawai school
by size; never-the-less, those sizes vary widely. Even a casual
glance at the graphs presented on pages 12 and
13 shows a 20cm range in the size of fish in each school.
That’s a big difference; it increases the chances our 1983
sample is truly representative of purse-seine caught fish at the
time because the concept of kahawai schooling “by size”
is really not so accurate.
- In 1994 Brian Jones did a bootstrap simulation of the data presented
in Table 2 from his 1994 stock assessment
paper (page 11 of this report). He selected any three of the 1991-92
means at random 600 times. The results were that 95% of the time
the 1991-92 catches had a smaller fork length than in 1983.
- The 32 line caught kahawai in the 1983 study had a mean size
of 49.8cm, a figure close to the size of the purse-seine caught
fish in 1983 and much larger than the sizes from the boat ramp
surveys (42.1cm in 1991 and 44.1cm in 1994) this decade. This
data is available on page 12.
-
The data presented on page 15
compares the fork length of line caught kahawai between 1983
and 1991. At all the locations with comparable data available
the fork length of kahawai have declined. This further supports
our argument that the fork length of kahawai available to recreational
fishers has declined over the past decade.
Table 2: Purse seine landings of kahawai sampled
in the Bay of Plenty in 1983, 1991 and 1992 (n = number in sample,
Mean = mean fork length, s.d = standard deviation).
| Date |
n |
Mean |
s.d. |
| 31/05/83 |
100 |
52.72 |
2.48 |
| 13/06/83 |
100 |
49.34 |
2.54 |
| 16/06/83 |
100 |
51.79 |
2.83 |
| |
|
|
|
| 14/05/91 |
3158 |
43.56 |
2.29 |
| 15/05/91 |
2758 |
37.16 |
4.91 |
| 27/05/91 |
821 |
45.46 |
3.96 |
| 28/05/91 |
741 |
45.19 |
4.39 |
| 31/05/91 |
1157 |
51.59 |
2.48 |
| 24/07/91 |
1029 |
45.83 |
4.23 |
| 05/08/91 |
2069 |
44.27 |
2.75 |
| 07/12/91 |
1029 |
49.62 |
3.30 |
| 04/01/92 |
300 |
50.40 |
1.97 |
| 08/01/92 |
560 |
45.99 |
2.50 |
| 11/04/92 |
564 |
53.6 |
2.60 |
| 14/04/92 |
3152 |
50.29 |
2.22 |
| 15/04/92 |
1493 |
41.15 |
5.00 |
| 16/04/92 |
1287 |
32.17 |
1.21 |
| 27/05/92 |
2620 |
43.45 |
3.66 |
| 28/05/92 |
2174 |
44.49 |
3.57 |
| 29/05/92 |
769 |
44.75 |
3.84 |
| 06/08/92 |
418 |
32.35 |
1.22 |
| 06/08/92 |
422 |
42.42 |
2.91 |
| 30/09/92 |
610 |
50.77 |
2.78 |
| 30/09/92 |
801 |
51.23 |
2.54 |
| 04/10/92 |
1104 |
45.42 |
4.05 |
| 11/10/92 |
577 |
46.96 |
2.42 |
| 11/10/92 |
646 |
51.27 |
2.55 |
| 12/10/92 |
333 |
36.00 |
1.49 |
| 02/12/92 |
726 |
54.10 |
1.98 |
| 10/12/92 |
747 |
38.33 |
4.45 |
| 16/12/92 |
239 |
50.90 |
2.50 |
| 16/12/92 |
257 |
36.95 |
2.61 |
(From: Kahawai information presented at the 1994 Stock Assessment
by J.B. Jones)
TOP
Biological Sampling
Data on length frequencies,
sex composition, age frequencies (otolith readings), and stomach
contents were collected from commercial landings and during tagging
studies from damaged fish.
Age and length frequencies
Little information on kahawai spawning and nursery areas is available,
but it appears that most sheltered bays and estuaries in the North
Island are used as nurseries, especially those off the east coast,
north of the Bay of Plenty. Apart from the sheltered estuarine waters
in Tasman Bay and near Farewell Spit, juveniles have not been found
in substantial numbers in South Island waters (NZ Ministry of Agriculture
and Fisheries unpublished data).
Age and fork length measurements were taken from kahawai caught
in several areas (Table 7). Although the catching
methods varied, the lengths of the fish en each area did not vary
with the method used (Tables 8a-d). Fish caught
by purse seine were assumed to represent local fish because the
mesh size of the nets was small enough to retain juvenile, as well
as mature, kahawai. Relatively more small fish were caught by line
than by purse seine, but this was probably because lining was usually
used to catch fish in sheltered nearshore waters where smaller kahawai
are often found. Within each area fish size did not vary substantially
between schools, though fish in one of the two schools sampled from
east Tasman Bay on 21 April 1983 were reported as being larger than
usual for the area.
Although almost 20% of the sample taken by setnet from the Waitaki
River in 1984 comprised small fish of about 40cm, the sample taken
by line in 1983 from this area had no fish of this size. It is unlikely
that this absence of small fish resulted from the fishing method
used, because 40cm fish were caught by lining in other areas that
year; it is more probable that there were no small fish in the sampling
area in 1983. Excluding this sample, the length frequencies of fish
caught by the two methods were similar.
Whole otoliths were read by the method described by Eggleston (1975).
For otoliths which required burning to read, rings were clearer
when the otolith was sectioned and polished before burning (Paul
1976, James 1984). The age – length relationships were similar
to those reported by Eggleston (1975). An age – length frequency
plot for all samples combined is given in Table 9. Although mean
length and age increased with latitude on the east coast South Island,
this trend was not apparent in other areas (see Table 7). Movement
of tagged fish between the North and South Islands..
Table 7: Age and length data for kahawai from areas
sampled
| Area |
n |
Mean |
Median |
s.d.* |
Age (y)
Min-Max + |
| Northland |
38 |
8.7 |
8 |
3.95 |
3-23 |
| Bay of Plenty |
300 |
8.2 |
8 |
2.57 |
4-16 |
| Ariel Bank |
97 |
8.8 |
9 |
1.57 |
5-12 |
| Waikato River (1983) |
22 |
5.6 |
6 |
1.68 |
3-11 |
| Waikato River (1984) |
100 |
9.8 |
10 |
2.11 |
6-16 |
| New Plymouth |
39 |
8.5 |
8 |
4.25 |
3-18 |
| Wellington Harbour |
137 |
8.1 |
8 |
2.52 |
2-20 |
| South Taranaki Bight |
398 |
8.4 |
8 |
2.22 |
4-21 |
| Farewell Spit |
300 |
6.1 |
5 |
2.14 |
4-14 |
| East Tasman Bay |
149 |
11.1 |
11 |
2.84 |
7-19 |
| Inner Tasman Bay |
100 |
4.2 |
4 |
0.43 |
3-05 |
| Clifford Bay |
198 |
10.4 |
10 |
3.52 |
5-22 |
| Kaikoura (1981) |
287 |
12.6 |
12 |
3.27 |
6-24 |
| Kaikoura (1982) |
569 |
12.5 |
12 |
2.87 |
7-23 |
| Waitaki River |
150 |
15.7 |
17 |
5.31 |
5-23 |
* Standard deviation
+ Minimum to maximum age
| Area |
n |
Mean |
Median |
s.d.* |
Length (cm)
Min-Max + |
| Northland |
38 |
48.2 |
48 |
6.50 |
34-59 |
| Bay of Plenty |
300 |
51.3 |
52 |
3.00 |
42-58 |
| Ariel Bank |
97 |
48.3 |
49 |
2.71 |
39-54 |
| Waikato River (1983) |
22 |
38.6 |
39 |
5.12 |
28-49 |
| Waikato River (1984) |
100 |
48.5 |
49 |
2.76 |
41-57 |
| New Plymouth |
40 |
45.0 |
48 |
9.43 |
21-59 |
| Wellington Harbour |
137 |
47.0 |
49 |
6.15 |
21-56 |
| South Taranaki Bight |
400 |
48.0 |
48 |
2.87 |
40-58 |
| Farewell Spit |
300 |
46.0 |
47 |
4.13 |
37-56 |
| East Tasman Bay |
150 |
52.2 |
52 |
2.77 |
44-59 |
| Inner Tasman Bay |
100 |
36.6 |
37 |
2.16 |
28-44 |
| Clifford Bay |
199 |
51.4 |
52 |
3.60 |
39-61 |
| Kaikoura (1981) |
293 |
53.1 |
53 |
2.70 |
46-60 |
| Kaikoura (1982) |
572 |
52.9 |
53 |
2.56 |
44-62 |
| Waitaki River |
151 |
53.7 |
56 |
6.24 |
28-62 |
* Standard deviation
+ Minimum to maximum age
Table 8a: Length frequencies for Bay of Plenty
samples by date and method of capture
| Length
(cm) |
Purse
seine
31
May
1983 |
Line
3-15
June
1983 |
Purse
seine
13
June 1983 |
Purse
seine
16
June
1983 |
| 38 |
- |
1 |
- |
- |
| 39 |
- |
- |
- |
- |
| 40 |
- |
1 |
- |
- |
| 41 |
- |
1 |
- |
- |
| 42 |
- |
1 |
- |
1 |
| 43 |
- |
1 |
- |
- |
| 44 |
- |
- |
1 |
- |
| 45 |
- |
- |
5 |
- |
| 46 |
- |
1 |
5 |
- |
| 47 |
- |
1 |
11 |
8 |
| 48 |
4 |
1 |
23 |
3 |
| 49 |
6 |
4 |
12 |
13 |
| 50 |
14 |
5 |
13 |
9 |
| 51 |
7 |
3 |
9 |
5 |
| 52 |
17 |
3 |
6 |
17 |
| 53 |
10 |
3 |
9 |
16 |
| 54 |
20 |
1 |
3 |
12 |
| 55 |
7 |
1 |
2 |
8 |
| 56 |
7 |
4 |
1 |
3 |
| 57 |
6 |
- |
- |
4 |
| 58 |
2 |
- |
- |
1 |
| Total |
100 |
32 |
100 |
100 |
TOP
Appendix 1
Appendix 2
TOP
Comparison between
average kahawai length (fork length cm) caught during the 1983
kahawai tagging programme and the 1991 recreational fishing survey.
| Year |
Area |
Method |
Time period |
Av.
Length |
No.
of
fish |
| 1983/84 |
Whangaroa – Bay of Islands |
Trolling |
Dec – Feb |
48.2 |
334 |
| 1991 |
Bay of Islands |
Baitfishing mainly |
Xmas – April |
41.2 |
96 |
| 1983/84 |
Bream Head – Sail Rock |
Trolling |
Dec – Feb |
51.2 |
268 |
| 1991 |
Bream Head – Sail Rock |
Baitfishing mainly |
Xmas – June |
45.8 |
78 |
| 1983 |
Motu River |
Surfcasting |
March |
50.1 |
301 |
| 1991 |
Motu area (Torere-Omaio) |
Surfcasting |
March |
43.3 |
18 |
| 1983 |
Wanganui – New Plymouth |
Trolling |
Jan – May |
48.6 |
776 |
| 1991 |
Wanganui – New Plymouth |
Baitfishing mainly |
April – May |
46.3 |
88 |
| 1983 |
Ahipara |
Trolling near the surfline |
December |
45.6 |
78 |
| 1991 |
90 Mile Beach |
Surfcasting |
April – May |
41.8 |
30 |
| 1991 |
Hokianga entrance |
Surfcasting |
March – May |
39.8 |
53 |
Comparison between average kahawai length (fork length
cm) caught by trolling and baitfishing during the 1991 recreational
survey
| Area |
Method |
Time period |
Av. Length |
No. of fish |
| Northland |
Bait fishing |
Dec – June |
42.7 |
317 |
| |
Trolling |
Dec – June |
37.7 |
129 |
| Hauraki Gulf |
Bait fishing |
Dec – June |
36.1 |
585 |
| |
Trolling |
Dec – June |
33.3 |
235 |
| Bay of Plenty |
Bait fishing |
Dec – June |
43.2 |
2277 |
| |
Trolling |
Dec – June |
40.1 |
1081 |
| West Coast |
Bait fishing |
Dec – June |
41.8 |
2583 |
| |
Trolling |
Dec – June |
46 |
40 |
TOP
Decline in Recreational CPUE Around the
Motu River Mouth From 1982 to 1991
Summary
From January – April 1982 a recreational survey at the Motu
River mouth in the Bay of Plenty revealed a CPUE of 2.55 kahawai
per hour for visitors to the area and 4.17 fish per hour for the
local residents.
From March – April 1991 a MAF survey of the area from Opotiki
to Te Kaha (includes the Motu) showed a CPUE of 0.1 kahawai per
hour. This comparison is not ideal because the survey area in
1991 included areas outside the Motu and a different time period.
However, the surveyor in 1991 has stated that catch rates at the
river mouth were approximately the same as other areas along the
beach, and peak catches in the area generally occur in March (a
month included in both surveys). We also provide a new set of
data that involves just the beach area from Torere to Omaio (clustered
right around the river mouth) that indicates a catch rate of 0.09
kahawai per hour during peak season in March 1992.
Available Data from 1982 and 1991
| Data from the
1982 survey of recreational fishing
at the Motu River mouth only |
Time Period |
# Fishers |
CPUE (kah/hr) |
Jan-Apr |
506 |
2.55 |
For a more detailed graph see page
18.
| Data from the
1991 Recreational Survey
From Torere to Omaio (includes Motu River mouth) |
Month |
# Fishers |
CPUE
(kah/hr) |
Standard
Error |
March |
56 |
0.09 |
0.010 |
April |
28 |
0.03 |
0.008 |
May |
11 |
0.05 |
0.040 |
June |
37 |
0.11 |
0.013 |
July |
34 |
0.01 |
0.003 |
Return
to the option4 kahawai IPP rebuttal index page for more
info »
Latest news and background information on kahawai available
here »
TOP
|