MFish
Pelagic Fishery Assessment Working Group Meeting
Ministry
of Fisheries chaired meeting held in
Auckland
on 11th March 2004
Report
by John Holdsworth for NZ Big Game Fishing Council
| Chair: |
Neville Smith MFish |
| Recreational Reps: |
John Holdsworth NZBGFC |
| Commercial Reps: |
Greg Lydon SeaFIC, Andrew Bond Sanfords, Peter Ballantine
Tuna Fishers |
| Iwi Reps: |
Jack Parata |
| Research Providers: |
Paul Taylor, Bruce Hartill NIWA, Tim Sippel Massey |
| Ministry of Fisheries: |
Graeme McGregor, Arthur Hore, Talbot Murray |
Introduction
The meeting reviewed the
results of recently completed research projects including two NZ
Marine Research Foundation projects on kahawai and striped marlin.
We also looked at two late proposals for tagging research projects.
Meeting Started 10.00am
Characterisation
of the amateur fishery for kahawai in New Zealand
Paul Taylor from NIWA presented
the results of this NZ Marine Research Foundation project. This
report brings together existing data on the kahawai fishery and
provides a more in-depth look at where and when most kahawai is
caught by 40 recreational fishing zones around the country. The
1996 national survey data showed that the largest harvest is coming
from the Bay of Plenty zones with the south Taranaki Bight, Taranaki
itself and Hawkes Bay also important. For the number of fishers
in Auckland the catch was relatively modest with most coming from
the Hauraki Gulf and Manukau Harbour. See Figure 1. Most kahawai
were caught in summer and autumn in The Bay of Plenty, Hauraki Gulf
and Northland while on the west coast more of the catch was taken
in Spring. Around the lower North Island the summer fishery took
about half of the kahawai for the year. In the South Island kahawai
catch is small and mostly taken over summer.
The length of kahawai measured
at boat ramps was compared between 3 surveys in the 1990s (1991,
1994, 1996) and three recent surveys (2001, 2002, 2003) in KAH1.
In east Northland there seems to be less of the really big fish
and less small fish landed by fishers in recent surveys but the
average size of kahawai has remained much the same. In the Hauraki
Gulf the fish tend to be smaller with less but steady amount of
larger fish. The average size landed at boat ramps in the Hauraki
has declined. In the Bay of Plenty like Northland there seem to
be less of the really big fish and small fish landed. The average
size is about the same or a little less but the proportion of quite
large fish around 50cm seems to have increased.
Figure 1.
Kahawai harvest by recreational fishing zone and season.
The size of the circle is relative to the harvest estimate for that
zone from the 1996 national survey. The size of the slices are relative
to the catch in each zone by season.
There were some problems
with the way that the data was summarised. There was no attempt
to look at the catch per angler or catch per boat across the surveys.
There was a plot of the average number of kahawai per hour of interviewing
on boat ramps. There is a strong possibility of bias in this method
as the purpose of the recent surveys was to collect length and age
data on kahawai whereas the 3 surveys in the 1990's were designed
to collect a sample of average size of all species of fish. Also
the data from the 2000 and 2001 recreational diary surveys was not
used or was unavailable.
The full report had not been
circulated to all members of the Working Group so it was not appropriate
for the working group to adopt the report. Industry reps were a
little concerned how the report would be used. Neville said that
most of the report draws on previous surveys that have already been
reviewed and the short comings of those surveys had been noted.
In summary it was recommended that this version of the report should
be revised to include some cautions on the data used, some comparison
of the methods used to collect data over time and some better description
of trends over time. Paul asked if John H could provide written
comments on the report to aid this.
There was a suggestion that
to include the 2000 and 2001 survey data because it would be useful.
This may require additional work as part of a linked project.
TOP
Satellite
tagging of New Zealand striped marlin
The New Zealand Marine Research
Foundation funded a project to place six "smart" tags on striped
marlin last season. These tags can record the water depth and temperature
every 30-60 seconds and estimate the location of the fish daily.
All this information is stored by the electronic tag and transmitted
to Argos satellites only after the tag breaks away from the fish.
The results have been worked up by Tim Sippel as part of his Master
of Science degree at Massey University and in collaboration with
Blue Water Marine Research.
Five of the six tags reported
back after periods between 20 and 60 days attached to fish. The
sixth tag due to pop off after 109 days did not report back. The
tags collected information for a total of 201 days on fish. The
tags transmit a summary of their data to the Argos satellite system
based on specifications set by the users. The summaries are transmitted
because the tags don't have enough battery life to transmit the
entire data archive. However, if the tag itself is returned to researchers
they can download the entire dataset from the non-volatile flash
memory in the tag.
A combined depth plot showed
that these striped marlin spent about 70% of their time day and
night in the surface 5 metres of water and will dive to 50 to 100
metres quite regularly and occasionally to over 200m. The preferred
surface water temperature last season in New Zealand was between
21o and 23oC. One fish travelled to tropical waters and spent time
in water 28oC and warmer. This project has recorded the deepest
dive ever recorded by an electronically tagged striped marlin at
316 m and the coolest temperature at 14oC.
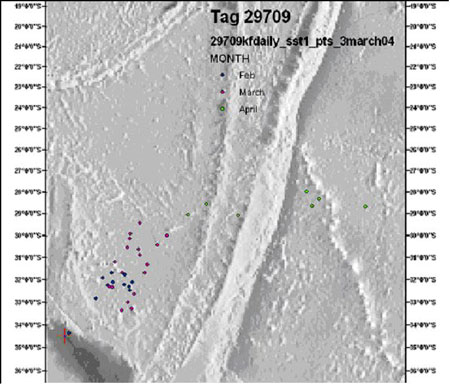
Working out the position
of these fish from day length and time of noon/midnight has been
the most challenging job so far. The tag manufacturer supplies software
that estimates longitude reasonably well and latitude less well.
These data were run through a statistical filter to give a better
estimate of longitude and then a programme that compares the surface
temperature measured by the tag with the satellite sea surface temperature
(SST) recorded around that time. This gives
much more reliable plots of location. A plot of all the locations
plotted for all tags is shown in Figure 2.
Figure 2.
Location plots for a 120kg fish tagged at North Cape in mid
February 2003. Note there may be more than one day between points.
Full results will be published
in the scientific literature and compiled into a report for the
NZ Marine Research Foundation. The presentation was well received
with interest in how the tags performed and how the data was analysed.
Some comments on how other depth recorders had performed in cold
conditions were offered. A suggestion was made that for a final
report it would be interesting to see how much commercial fishing
effort there was where the tags were each month.
TOP
Satellite
and archival tagging project for southern bluefin tuna (SBT)
MFish has contracted Talbot
Murray (ex NIWA) to plan and coordinate a project to place 50 archival
tags in SBT less than 40kg off the west coast of the South Island
in April/May 2004. These tags are internal and the fish must be
recaptured for the data to be retrieved. Also they will be tagging
10 SBT larger than 64 kg with pop-up satellite archival tags off
East Cape in June/July 2004. It is hoped these tags may track the
fish back to the spawning grounds.
This is a joint project with
the Australian Government which will allow some cost savings on
purchase of tags and training. Observers will be trained to handle
and tag the fish and placed on volunteer vessels at these times.
The crews will be compensated for the fish that they release and
their time helping handle the fish. There will be a reward of NZ$250
for the return of the tags. Talbot could not remember what
make of tag was being used. The total cost of the project was around
$200,000. A similar project is planned next season. And the analysis
of the results will be contracted out.
There was a lot of concern
from the industry that they were being forced to pay for this project
through cost recovery levies despite the fact that it was an international
research project and that was paid for by the Government in Australia
and Japan. Also the industry had some practical concerns about soak
times and practicalities of conducting this project as part of "normal"
fishing operations. There had obviously been plenty of discussion
on these issues outside the working group and we were seeing the
"tip of the iceberg".
Pop-up
satellite tagging of swordfish
Again this is a joint project
with the Australians planned for this year. It will be run in the
same way as the SBT project above, with tags deployed in July and
August with pop-up dates up to 6 months later. The Australians will
be starting sooner.
NZBGFC rep supported the
project (it is officially part of a swordfish stock structure project
that is currently underway) but suggested it need to be carefully
thought through.
Issues raised were;
- The timing would not tell us much about residency in New Zealand
as fish were thought to start migrating at about then.
- The longer the tags are on, the more chance of not hearing back
from them. Having a third of the tags at 6 month pop off was a
bit risky.
- Getting the attachment right is critical for long term deployments.
They might fall out.
- Geolocation of swordfish is impossible using light levels because
they dive at dawn and rise at dusk keeping the light quite constant.
- Maybe they should think about using a mix of archival and straight
pop off tags that only provide a location at the end, but are
much cheaper.
There was no request at this
meeting for assistance from recreational groups for more tags or
to catch fish. Unfortunately Talbot missed the presentation on the
striped marlin satellite tagging project.
Meeting ends 4.30 pm
The next Pelagic Working
Group Meeting will be on the 31st of March 2004 at MFish Auckland
Office .
TOP
|